Monitoring Azure SQL Databases with Terraform
Introduction
In today’s fast-paced and data-centric world, the performance, availability, and reliability of databases are crucial for the smooth operation of applications. Azure SQL Database, a fully-managed relational database service by Microsoft, offers high availability, security, and scalability. However, like any other critical component, it requires continuous monitoring to ensure optimal performance and to proactively address potential issues. In this guide, we will explore how to utilize Terraform, an Infrastructure as Code (IaC) tool, to set up monitoring for Azure SQL databases.
Importance of Monitoring Azure SQL Databases
Monitoring is essential for maintaining the health, performance, and security of Azure SQL databases. It helps in identifying bottlenecks, spotting unusual activities, and ensuring that resources are adequately provisioned. By setting up alerts on key metrics, administrators can receive immediate notifications on potential issues, reducing the mean time to resolution (MTTR) and enhancing the overall system reliability.
Key Metrics to Monitor
To maintain optimal performance and availability of your SQL database, it’s crucial to monitor various metrics and set up alerts. Focusing on the most critical metrics ensures that vital issues do not go unnoticed. Below is a list of key metrics that should be closely monitored, along with recommended practices for setting up alerts:
SQL DB Instance Memory Usage
Why It’s Important: High memory usage can lead to degraded performance and slower response times.
Recommended Alerting Strategy:
- Set up an alert with severity level 1 for memory usage above 90% to catch critical situations where performance might be severely impacted.
- Configure additional alerts with decreasing severity levels (e.g., severity level 2 for 80%, severity level 3 for 70%) to detect and address issues before they become critical.
SQL DB instance CPU Percentage
Why It’s Important: Monitoring CPU usage is essential for identifying queries or jobs that are consuming excessive resources, which can lead to slower performance.
Recommended Alerting Strategy:
- Implement an alert with a high severity level when CPU usage surpasses a critical threshold, such as 90%, ensuring immediate attention to potential performance issues.
- Create alerts with lower severity levels at lower thresholds (e.g., 80%, 70%) to proactively manage and optimize CPU utilization.
Session Percentage
Why It’s Important: High session usage could indicate an unusually large number of connections, potentially leading to performance issues and resource contention.
Recommended Alerting Strategy:
- Establish an alert with a high severity level for scenarios where session usage is exceptionally high, allowing for quick intervention.
- Use alerts with lower severity levels at decreasing thresholds to monitor and maintain optimal connection levels.
Workers Percentage
Why It’s Important: Monitoring workers percentage ensures that there are sufficient workers available to handle concurrent sessions, which is crucial for maintaining performance.
Recommended Alerting Strategy:
- Configure an alert with a high severity level for situations where worker usage is approaching its maximum capacity.
- Set up additional alerts with lower severity levels at lower thresholds to maintain a balanced load and prevent issues from escalating.
In-Memory Storage Percentage
Why It’s Important: Monitoring in-memory OLTP storage utilization ensures that it doesn’t become a performance bottleneck, particularly for applications that rely heavily on in-memory operations.
Recommended Alerting Strategy:
- Implement a high-severity alert for when in-memory storage usage is critically high, ensuring immediate attention to prevent performance degradation.
- Configure alerts at various thresholds with descending severity levels to actively manage in-memory storage and optimize performance.
By implementing this tiered alerting strategy, you ensure that your team is notified of potential issues at various criticality levels, allowing for proactive management and quicker resolution of performance-related issues. This approach not only helps in maintaining the health of your SQL instance but also contributes to a smoother and more reliable user experience.
Full list of supported metrics for SQL DB can be found here: https://learn.microsoft.com/en-us/azure/azure-monitor/reference/supported-metrics/microsoft-sql-servers-databases-metrics
Terraform Resources and Blocks Explained
1. Provider Block
The azurerm provider block is used to configure the Terraform provider for Azure. This block specifies that we are going to interact with Azure resources.
provider "azurerm" {
  features {}
}
2. Terraform Block
This block specifies the required providers and their versions.
terraform {
  required_providers {
    random = {
      source  = "hashicorp/random"
      version = "3.5.1"
    }
  }
}
3. Random Password Resource block
This resource generates a random password that will be used for the SQL administrator.
resource "random_password" "password" {
  length  = 16
  special = true
}
4. Azure Resources
Various Azure resources are defined, such as azurerm_resource_group, azurerm_key_vault, azurerm_key_vault_secret, azurerm_mssql_server, and azurerm_mssql_database. Each of these resources creates a specific Azure resource, with configurations provided through the code.
data "azurerm_client_config" "current" {}

resource "azurerm_resource_group" "example" {
  name     = "RG-sql-monitoring-01"
  location = var.location
}


resource "azurerm_key_vault" "example" {
  name                     = "kv-sql-monitoring-01"
  location                 = var.location
  resource_group_name      = azurerm_resource_group.example.name
  tenant_id                = data.azurerm_client_config.current.tenant_id
  purge_protection_enabled = false

  sku_name = "standard"

  access_policy {
    tenant_id = data.azurerm_client_config.current.tenant_id
    object_id = data.azurerm_client_config.current.object_id

    key_permissions = [
      "Get",
      "Delete",
      "Update",
      "Purge",
      "List"
    ]

    secret_permissions = [
      "Get",
      "Delete",
      "Purge",
      "List",
      "Set"
    ]
  }
}
resource "azurerm_key_vault_secret" "example" {
  name         = "sql-monitoring-db-password"
  value        = random_password.password.result
  key_vault_id = azurerm_key_vault.example.id

  lifecycle {
    ignore_changes = [value]
  }
}

resource "azurerm_mssql_server" "example" {
  name                         = "sql-myazuresqlserver-01"
  location                     = var.location
  resource_group_name          = azurerm_resource_group.example.name
  version                      = "12.0"
  administrator_login          = "adminuser"
  administrator_login_password = azurerm_key_vault_secret.example.value
}

resource "azurerm_mssql_database" "example" {
  for_each = toset(var.databases)

  name      = each.value
  server_id = azurerm_mssql_server.example.id
  sku_name  = "S0"                           //Optional
  collation = "SQL_Latin1_General_CP1_CI_AS" //Optional
}
5. Azure Monitor Action Group and Metric Alert resource blocks
resource "azurerm_monitor_action_group" "alert_action_group" {
  name                = "database-alert-action-group"
  resource_group_name = var.resource_group_name
  short_name          = "dbalerts"
  location            = "global"

  dynamic "email_receiver" {
    for_each = var.alert_emails
    content {
      name          = "email_${email_receiver.key}"
      email_address = email_receiver.value
    }
  }
}
resource "azurerm_monitor_metric_alert" "db_metrics_alert" {
  for_each = local.combined_map

  name                = "${each.value.metric.metric_type} - ${each.value.db}"
  resource_group_name = azurerm_resource_group.example.name
  scopes              = [azurerm_mssql_database.example[each.value.db].id]
  description         = each.value.metric.alert_description

  severity    = each.value.metric.severity
  window_size = each.value.metric.window_size
  frequency   = each.value.metric.frequency

  criteria {
    metric_namespace = "Microsoft.Sql/servers/databases"
    metric_name      = each.value.metric.metric_name
    aggregation      = each.value.metric.aggregation
    operator         = each.value.metric.operator
    threshold        = each.value.metric.threshold
  }

  action {
    action_group_id = azurerm_monitor_action_group.alert_action_group.id
  }
}
The azurerm_monitor_action_group resource is used to define an action group for alerts, while azurerm_monitor_metric_alert sets up metric alerts based on the defined criteria.
Importance of Using for_each and combined_map combined with Terraform flatten function
locals {
  combined_list = flatten([for db in var.databases : [for metric in var.alert_metrics : { db = db, metric = metric }]])
  combined_map  = { for item in local.combined_list : "${item.db}-${item.metric.metric_type}" => item }
}
The use of for_each along with combined_map in the azurerm_monitor_metric_alert resource allows us to create multiple metric alerts with a single block of code. This is not only efficient but also makes the code cleaner and easier to manage.
The combined_map is a map constructed from a list of objects, where each object represents a combination of a database and a metric. This structure is particularly powerful because it enables the creation of unique and descriptive names for each alert, ensuring clarity and ease of management.
The flatten function plays a crucial role. Here’s a detailed explanation of its functionality and importance in this use case:
Purpose of flatten:
The flatten function in Terraform is used to transform a list of lists (or a complex nested list structure) into a flat list. This is particularly useful when you have multiple nested loops and want to consolidate the results into a single list for easier processing.
Use Case Explanation:
In the provided example, there are two nested loops:
- The outer loop iterates over each database in
var.databases. - The inner loop iterates over each alert metric in
var.alert_metrics.
For each combination of database and alert metric, a map is created with the keys db and metric. The result of these nested loops is a list of lists of maps.
Variables Explained
Terraform variables are used to create configurable and reusable code. In this setup, variables such as databases, location, tags, administrator_login, alert_emails, alert_metrics, and several others are defined to store configuration settings.
variable "databases" {
default = ["db1","db2","db3"]
}
# Azure General
variable "resource_group_name" {
description = "Name of the Azure Resource Group to deploy resources into."
type = string
default = "RG-sql-monitoring-01"
}
variable "location" {
description = "Azure region for deployment."
default = "australiaeast"
type = string
}
variable "tags" {
description = "Resource tags."
type = map(string)
default = {}
}
variable "administrator_login" {
description = "Administrator login name for Azure SQL Server."
default = "adminuser"
type = string
}
# Alerting & Monitoring
variable "alert_emails" {
description = "List of email addresses to notify for alerts."
type = list(string)
default = ["This email address is being protected from spambots. You need JavaScript enabled to view it. ","This email address is being protected from spambots. You need JavaScript enabled to view it. "]
}
variable "alert_metrics" {
description = "List of metrics and their associated configurations for alerting."
type = list(object({
metric_type = string
metric_name = string
aggregation = string
operator = string
threshold = number
severity = number
window_size = string
frequency = string
alert_description = string
}))
default = [
{
metric_type = "SQL DB Instance Memory Usage"
metric_name = "sql_instance_memory_percent"
aggregation = "Average"
operator = "GreaterThan"
threshold = 90
severity = 4
window_size = "PT15M"
frequency = "PT15M"
alert_description = "Action will be triggered when memory usage is greater than 90%."
},
{
metric_type = "SQL DB Instance CPU Percentage"
metric_name = "sql_instance_cpu_percent"
aggregation = "Average"
operator = "GreaterThan"
threshold = 80
severity = 4
window_size = "PT15M"
frequency = "PT15M"
alert_description = "Action will be triggered when CPU percent is greater than 80%."
},
{
metric_type = "SQL DB Instance Session Percentage"
metric_name = "sessions_percent"
aggregation = "Average"
operator = "GreaterThan"
threshold = 80
severity = 4
window_size = "PT15M"
frequency = "PT15M"
alert_description = "Action will be triggered when session percentage exceeds 80%."
},
{
metric_type = "SQL DB Instance Workers Percentage"
metric_name = "workers_percent"
aggregation = "Average"
operator = "GreaterThan"
threshold = 80
severity = 4
window_size = "PT15M"
frequency = "PT15M"
alert_description = "Action will be triggered when workers percentage exceeds 80%."
},
{
metric_type = "SQL DB Instance In-Memory Storage Percentage"
metric_name = "xtp_storage_percent"
aggregation = "Average"
operator = "GreaterThan"
threshold = 80
severity = 4
window_size = "PT15M"
frequency = "PT15M"
alert_description = "Action will be triggered when in-memory storage usage exceeds 80%."
}
]
}
databases: A list of database names.location: The Azure region for deployment.tags: A map of resource tags.administrator_login: The SQL administrator login name.alert_emails: A list of email addresses for alert notifications.alert_metrics: A list of objects defining metric alert configurations.
Deploying resources - Terraform Plan and Apply
After successfully defining your resources in main.tf, and ensuring your configuration is correct through terraform plan, you can proceed to create and apply the configurations to your Azure environment using terraform apply.
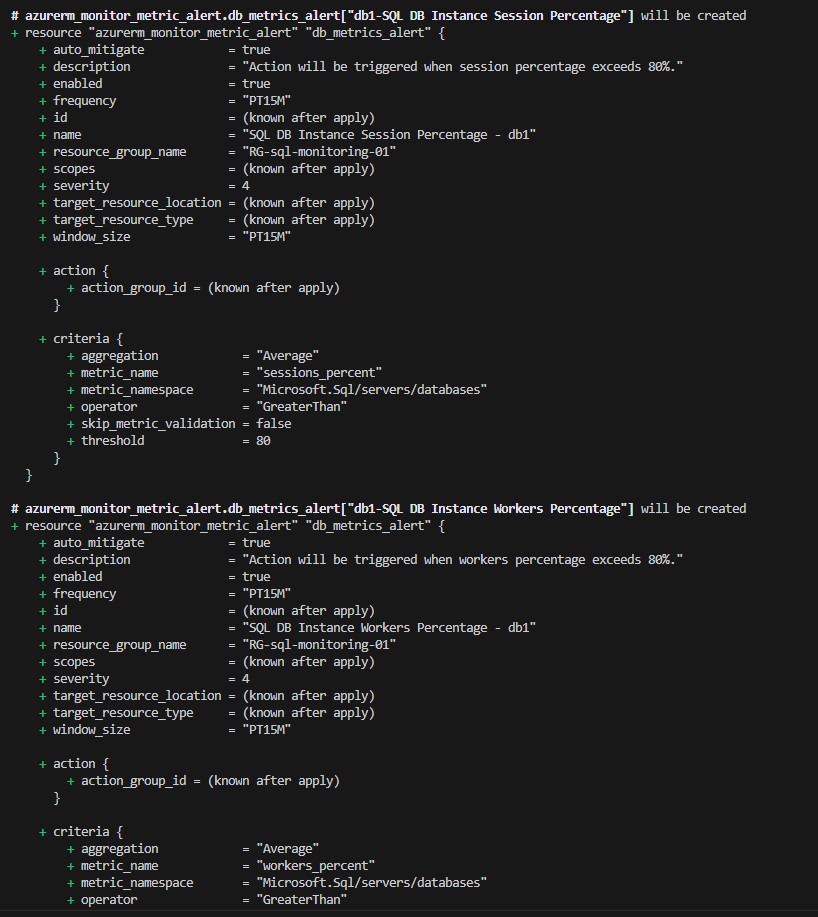
Once you run terraform apply, Terraform will present you with an execution plan that outlines what actions it will take based on the configurations in your main.tf file. This plan is generated to ensure that you are aware of the changes that will be made in your environment, providing a final check to prevent unintended actions.
From the provided example, you can see that Terraform plans to create various Azure resources including an Azure Key Vault, Key Vault Secret, Monitor Action Group, multiple Monitor Metric Alerts, a SQL Database, and a SQL Server. Additionally, it will generate a random password.
For each resource, Terraform provides detailed information on the properties that will be set, including those that will be known only after the apply operation is completed, such as IDs and URIs. Sensitive information, like the random password, is not displayed in the plan to protect it from exposure.
In this specific example, you can see resources like azurerm_key_vault, azurerm_key_vault_secret, azurerm_monitor_action_group, azurerm_monitor_metric_alert, azurerm_mssql_database, azurerm_mssql_server, and random_password are all going to be created. Each resource block in the output shows the properties that will be set and their respective values, giving you a comprehensive view of what will be deployed.
After reviewing the plan to ensure that everything is set up as expected, you can proceed to approve the plan, prompting Terraform to begin creating the resources in your Azure environment. Upon successful completion, your Azure resources will be created and configured as defined in your main.tf file, and the state of your infrastructure will be saved in the Terraform state file for future management and updates.

Conclusion
Monitoring Azure SQL databases is a critical aspect of database administration, ensuring high availability, performance, and security. By using Terraform, we can define, provision, and manage monitoring configurations as code, bringing in the benefits of version control, collaboration, and consistency. This guide provides a comprehensive setup for monitoring Azure SQL databases, focusing on critical metrics, and using best practices for alerting.
By following this guide and adapting the configurations to your specific needs, you can ensure that your Azure SQL databases are continuously monitored, and you are proactively alerted on potential issues, contributing to the overall stability and reliability of your applications.
This code is available on GitHub. You can find it by following this link: sokoloffmaks/AzureSQLDBMonitoring (github.com)