In a previous article titled "Monitoring and Alerting Azure SQL Databases with Terraform", we delved into the essential setup for Azure SQL database monitoring using Terraform, which included creating resources for database insights and initial alerting mechanisms. Building upon that foundation, this article will concentrate on expanding our monitoring capabilities to include specific checks for long-running queries and deadlocks within Azure SQL databases. By harnessing additional Terraform resources such as Log Analytics workspaces, diagnostic settings, and tailored alert rules, we can ensure a robust monitoring strategy that promptly alerts us to performance issues.
Setting Up the Log Analytics Workspace
A Log Analytics workspace is an Azure resource that collects, aggregates, and indexes data from various sources. In Terraform, in addition to our already defined resources from the previous post "Monitoring and Alerting Azure SQL Databases with Terraform", the below resource defined using the azurerm_log_analytics_workspace resource block:
resource "azurerm_log_analytics_workspace" "example" {
  name                = "my-log-analytics-workspace"
  location            = azurerm_resource_group.example.location
  resource_group_name = azurerm_resource_group.example.name
  sku                 = "PerGB2018"
}
The log analytics workspace is named my-log-analytics-workspace, set to the location of our previously created resource group, and uses the PerGB2018 pricing tier.
Implementing Diagnostic Settings for your Azure SQL Databases
With the log analytics workspace ready, we implement diagnostic settings that will send logs and metrics from our SQL databases to the workspace:
resource "azurerm_monitor_diagnostic_setting" "example" {
  for_each                   = toset(var.databases)
  name                       = "diagnostic-setting-${each.value}"
  target_resource_id         = azurerm_mssql_database.example[each.value].id
  log_analytics_workspace_id = azurerm_log_analytics_workspace.example.id

  dynamic "log" {
    for_each = var.log_categories
    content {
      category = log.value

      retention_policy {
        days    = 0
        enabled = false
      }
    }
  }

  metric {
    category = "AllMetrics"
    enabled  = true

    retention_policy {
      days    = 0
      enabled = false
    }
  }
}
Here, we use a dynamic block to create a log setting for each category defined in our var.log_categories variable. We're targeting multiple databases (var.databases) and configuring the retention policy for each.
Alerting with Action Groups
Next, we define an action group, which will determine the actions to take when an alert is triggered:
resource "azurerm_monitor_action_group" "alert_action_group" {
  name                = "database-alert-action-group"
  resource_group_name = var.resource_group_name
  short_name          = "dbalerts"
  location            = "global"

  dynamic "email_receiver" {
    for_each = var.alert_emails
    content {
      name          = "email_${email_receiver.key}"
      email_address = email_receiver.value
    }
  }
}
In this azurerm_monitor_action_group resource, we define email receivers dynamically based on var.alert_emails. Each email specified in the variable will receive alerts.
Creating Alert Rules for Long-Running Queries and Deadlocks
Finally, we set up specific alert rules for long-running queries and deadlocks using azurerm_monitor_scheduled_query_rules_alert:
Long-Running Queries
resource "azurerm_monitor_scheduled_query_rules_alert" "long_running_queries" {
  name                = "long-running-queries"
  location            = azurerm_resource_group.example.location
  resource_group_name = azurerm_resource_group.example.name

  trigger {
    operator  = "GreaterThan"
    threshold = 0

  }

  action {
    action_group           = [azurerm_monitor_action_group.alert_action_group.id]
    email_subject          = "Long Running Query Detected"
    custom_webhook_payload = "{}"
  }

  data_source_id = azurerm_log_analytics_workspace.example.id
  description    = "This alert rule checks for long-running queries."
  enabled        = true

  query       = <<-QUERY
  let LongRunningQueries = 10m; // Define long-running query threshold
  AzureDiagnostics
  | where Category == "SQLSecurityAuditEvents" and statement_succeeded_succeeded == "True"
  | where toint(query_duration_s) > LongRunningQueries
  | summarize Count = count() by bin(timestamp, 5m), serverName_s, databaseName_s, client_IP_s, statement_s
  | where Count > 0
  QUERY
  severity    = 3
  frequency   = 5
  time_window = 5
}
The above Terraform code snippet sets an alert rule to detect queries running longer than 10 minutes.
Deadlocks
resource "azurerm_monitor_scheduled_query_rules_alert" "deadlocks" {
  name                = "deadlocks"
  location            = azurerm_resource_group.example.location
  resource_group_name = azurerm_resource_group.example.name
  trigger {
    operator  = "GreaterThan"
    threshold = 0

  }

  action {
    action_group           = [azurerm_monitor_action_group.alert_action_group.id]
    email_subject          = "Deadlock Detected"
    custom_webhook_payload = "{}"
  }

  data_source_id = azurerm_log_analytics_workspace.example.id
  description    = "This alert rule checks for deadlocks."
  enabled        = true

  query       = <<-QUERY
  AzureDiagnostics
  | where Category == "SQLDeadlockEvents"
  | summarize Count = count() by bin(timestamp, 5m), serverName_s, databaseName_s
  | where Count > 0
  QUERY
  severity    = 3
  frequency   = 5
  time_window = 5
}
This rule monitors the SQLDeadlockEvents and raises an alert when a deadlock is detected.
The azurerm_monitor_scheduled_query_rules_alert resource is utilized within Terraform to create log search alert rules. Here's why and how it's used in our case:
-
Long-Running Queries: The Terraform configuration for this alert rule uses a KQL (Kusto Query Language) statement to identify queries that run longer than a pre-defined duration. This is something that isn't directly exposed as a metric but can be extracted from log data. Once identified, the configuration specifies the action to be taken, which includes notifying the responsible parties via the defined action group.
-
Deadlocks: Similarly, deadlocks aren't typically surfaced as metrics but are instead events that are logged by the database. Using the
azurerm_monitor_scheduled_query_rules_alertresource, we can write a query that searches the logs for deadlock events and triggers alerts accordingly.
These log search alerts are a powerful tool for more complex monitoring scenarios where the state you're interested in isn't a simple number but might be an event or a pattern that only emerges when you analyze the log data over time. By incorporating these into our Terraform configurations, we not only automate their creation but also ensure that they're versioned, repeatable, and transparent, leading to more robust and maintainable infrastructure management practices.
Understanding the log_categories Variable
In the provided Terraform configuration, we introduce a variable named log_categories which plays a crucial role in the diagnostic settings for our Azure SQL databases:
variable "log_categories" {
  type = list(string)
  default = [
    "SQLSecurityAuditEvents",
    "DatabaseWaitStatistics",
    "Deadlocks",
    "Blocks",
    "Timeouts"
    // Add all other categories you are interested in
  ]
}
This variable is a list of strings, each representing a specific category of diagnostic logs that we want to capture and send to our Log Analytics workspace. The categories include:
SQLSecurityAuditEvents: Security-related events such as access changes and login attempts.DatabaseWaitStatistics: Metrics pertaining to the time that database sessions spend waiting for various resources.Deadlocks: Events that occur when two or more sessions permanently block each other by each session having a lock on a resource the other sessions are trying to lock.Blocks: Occurrences when one session holds a lock for a longer period than is typical, preventing other sessions from proceeding.Timeouts: Events where operations are not completed within an expected timeframe.
By setting up these categories, we ensure that our monitoring setup is comprehensive, capturing a wide array of potential performance and security issues within our Azure SQL databases.
The Impact of Running terraform plan and terraform apply
When executing terraform plan, Terraform performs a dry run to show you what actions it will take based on the current configuration without making any actual changes to your infrastructure. This command is an essential step in the Terraform workflow, as it allows you to review and verify the changes before they are applied.
The output of terraform plan will list the resources Terraform intends to create, update, or destroy. For our Azure SQL database monitoring setup, terraform plan will show us the creation of the Log Analytics workspace, the diagnostic settings for each SQL database, the action group configuration, and the setup of the alert rules for long-running queries and deadlocks.
Upon running terraform apply, Terraform will proceed to apply the changes specified in your configuration. It will prompt you for confirmation before it executes any changes, giving you one last look to ensure that everything is as expected.
After confirmation, Terraform will create the Log Analytics workspace, enabling the collection and aggregation of logs and metrics. It will configure the diagnostic settings for the SQL databases, ensuring the specified log categories are captured. The action group will be set up to send alerts to the specified email addresses. Lastly, the alert rules for detecting long-running queries and deadlocks will be activated, monitoring for these specific conditions and triggering alerts as configured.
In conclusion, after running terraform apply, if everything goes as planned, you'll have a fully functional, automated monitoring setup that vigilantly watches over your Azure SQL databases for any performance-related issues, with the ability to alert the designated personnel immediately upon detection of defined conditions.
Viewing changes in Azure portal
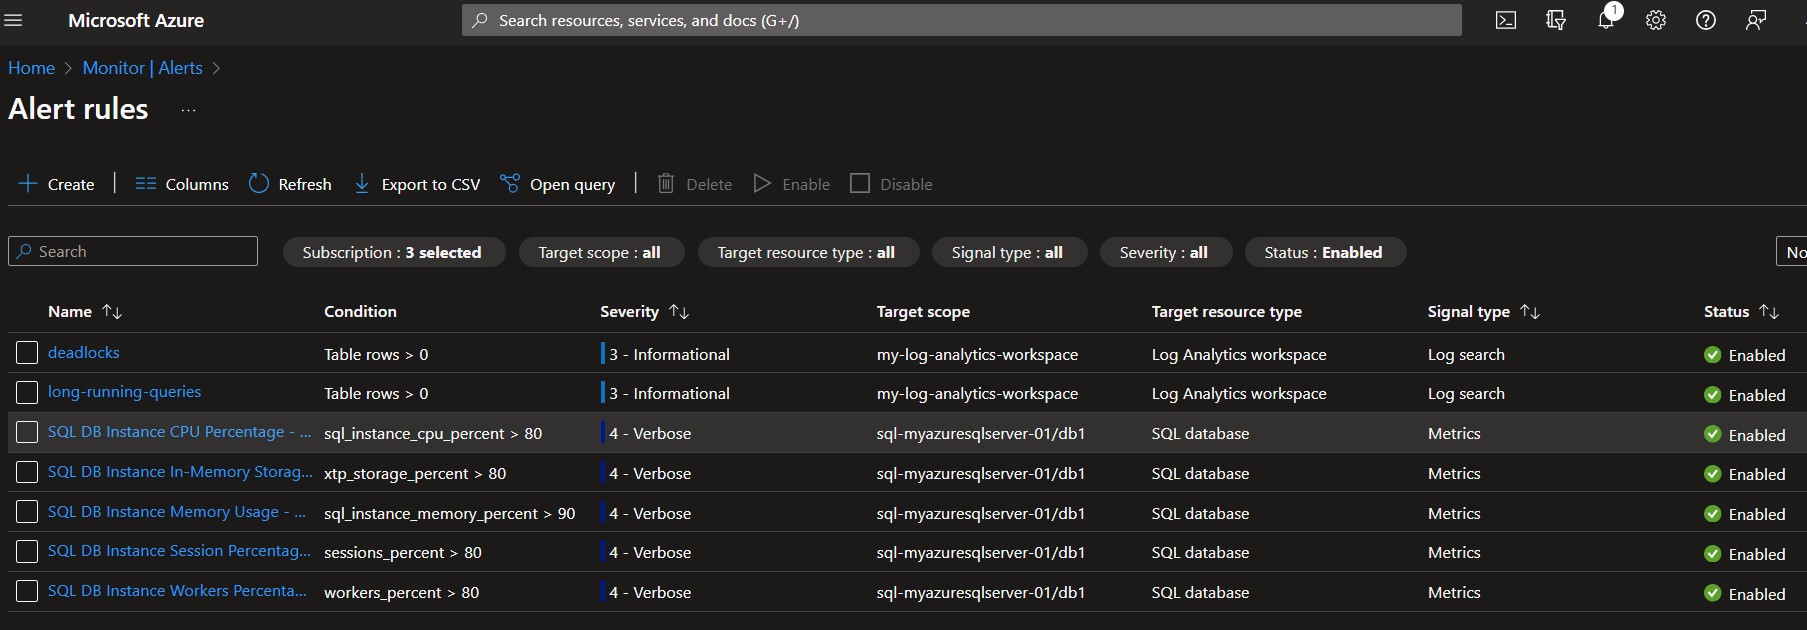
Following the successful execution of terraform apply, the changes will be implemented within your Azure environment. By navigating to the Azure portal, you can visually confirm the creation and configuration of new alert rules under the "Monitor/Alerts/Alert Rules" section.
These new alert rules will be reflective of the Terraform configurations you've just applied. You will see an alert rule named "long-running-queries," designed to monitor and send notifications if any queries exceed the defined execution time threshold, and another named "deadlocks," set to alert on the occurrence of any database deadlock events. Both will be tied to the Log Analytics workspace and ready to utilize the diagnostic data that's being collected.
Azure portal's user interface provides a convenient, at-a-glance view of all alert rules, their statuses, and the specifics of their configurations, such as their severity levels, frequency, and the time window for data evaluation. This visual confirmation acts as an additional assurance that your monitoring setup is active and configured as intended, ready to assist you in maintaining the performance and reliability of your Azure SQL databases.

Conclusion
This article detailed how to extend your Azure SQL Database monitoring to include performance-related aspects such as long-running queries and deadlocks using Terraform. By adding these advanced monitoring setups, we're enabling a more comprehensive oversight of our databases, ensuring we can react swiftly to maintain performance and minimize disruptions. The incorporation of Log Analytics workspaces, diagnostic settings, and specialized alert rules can significantly contribute to the overall health and efficiency of our database systems in Azure.